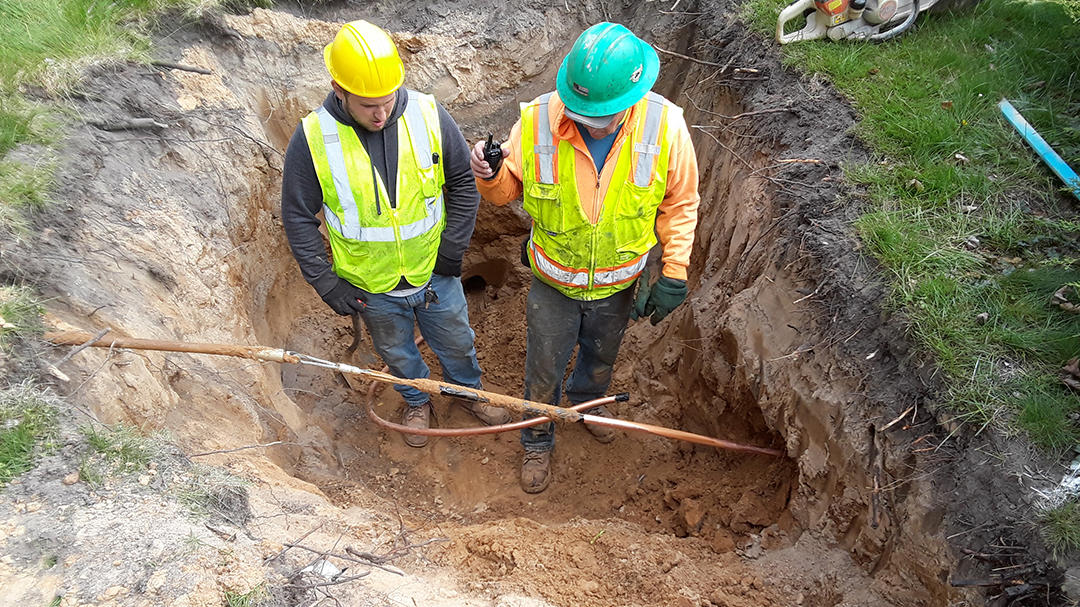
Along the coast of Lake Michigan, the city of Benton Harbor, Michigan, has, until recently, faced steep resource challenges in completing a much-needed, large-scale lead service line replacement project.
Benton Harbor is not alone in the challenge it faces in replacing existing lead service lines. Lead service lines are still prevalent across the country and in the State of Michigan in particular.
According to the National Resources Defense Council (NRDC), “As many as 12 million lead pipes — and possibly more — carry drinking water to the homes of up to 22 million or more people across the country.” These lead service lines have long been recognized as the primary contributor to lead in drinking water.
Benton Harbor’s water distribution system is more than 100 years old, and many homes were built before the 1960s. Water from the city’s water plant doesn’t have lead in it; however, many of the water service lines from the property line to the homes are made of lead or have lead components, as do some public water service lines.

With funding from the Environmental Protection Agency (EPA) and the state of Michigan — and a commitment from Michigan Governor Gretchen Whitmer to replace all service lines within 18 months — the rejuvenated replacement project kicked off in early November 2021. The city engineering firm for Benton Harbor, Abonmarche, set about coordinating lead service line replacement efforts for a project that would be operating for many months at a break-neck pace.
Abonmarche’s goal was to create a solution to track and share the progress of a large and fast-moving lead service line replacement project. As an added benefit of the project, data collected will be incorporated into the comprehensive asset management program being developed for the city.
By blending Abonmarche’s digital solutions expertise and solid foundation of geographic information system (GIS) knowledge and experience into our engineering work, we were able to elevate this high-profile project to an efficient, successful operation that demonstrates best practices. The model and approach we are developing for Benton Harbor will serve as a precedent for future projects in other communities across the Midwest.
Implementing Esri’s Lead Service Line Inventory Solution
Deploying an Esri Architecture, Engineering, and Construction (AEC) Project Delivery service and ArcGIS Online for the city, Abonmarche was able to quickly set up a water service line inventory. The deployment was based on existing water account records, record inspections, and previously identified replacements, making use of Esri’s ArcGIS Field Maps mobile app. Data was then shared with the public in real time through the ArcGIS Hub community engagement site and associated dashboard.
The dashboard and hub site have changed the face of a critical community health initiative. Benton Harbor’s ability to share accurate, up-to-date information with the public has established transparency from the project’s onset, setting a foundation for building trust.
Abonmarche used Esri’s Lead Service Line Inventory solution as a base framework to configure and customize the project’s specific needs and goals. This industry-specific solution helped to easily set up the necessary data layers, maps, and applications, enabling Benton Harbor to go above and beyond to communicate with the community.
“Working in GIS was the perfect solution for this type of project. We wanted something thorough and reliable, yet easy to deploy in order to keep up with the pace of the project. Seeing inspections and construction results in real time has been key to monitoring issues as well as sharing results. Recording and publishing the progress with GIS has been so much more efficient than the processes of the past.”
Garrick Garcia, GIS Technician, Abonmarche
Esri’s Lead Service Line Inventory solution came with a number of built-in maps. Abonmarche configured those maps to fit the project’s requirements, then integrated them into the ArcGIS Field Maps mobile app to become part of the final workflow solution. Then, using the Project Manager Web App from the ArcGIS Solutions collection, Abonmarche designed the ability to track which service lines have been replaced, which service lines have yet to be replaced, and a host of other valuable information. Finally, several custom web applications and dashboards were created to interact with the out-of-the-box solutions apps so that additional project requirements could be easily managed. This suite of web maps and applications has provided contractors, inspectors, project managers, and office administrators with the ability to communicate directly and coordinate the work that is being performed.
The hub provided by the Esri solution was a great template that was modified to show the information the city wanted. Multiple pages were added to the site with embedded content and links to informational PDF documents and required forms.
Meeting Project Goals
Alongside the Lead Service Line Inventory solution, the Abonmarche team implemented a host of other supporting Esri solutions and applications. This provided a strong foundation to jump-start the project while required customization and applications were being developed to meet all of Benton Harbor’s organizational goals. Various applications and dashboards were created to provide the ability to
- Organize and track all the required Right of Entry (ROE) permission forms, as well as all feedback received from the community about the project.
- Log mobile work into the GIS.
- Enter service line information into the GIS from the office environment.
- Quickly track work that was being done and categorize that work to quantify the results for informative purposes.
- Share real-time data with the public in an easy-to-digest method.
Administrative Desktop App
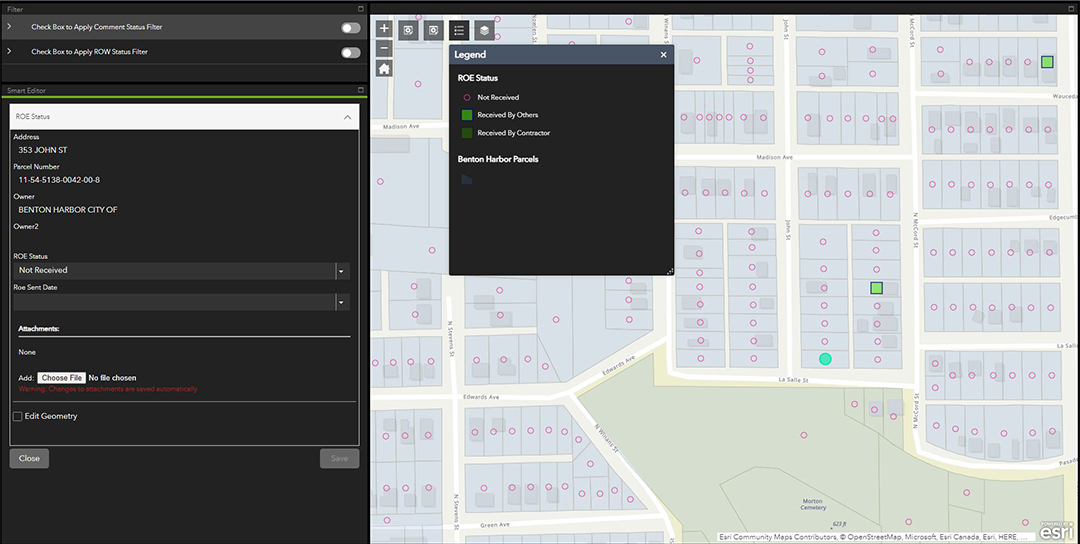
The custom Administrative Desktop App enables the project team to organize and track all required Right of Entry permission forms, as well as all feedback received from the community about the project. As part of the process of updating service lines, the City of Benton Harbor is required to collect a Water Service Line Agreement Form from each property owner, granting permission to enter the property and complete the service line replacement work. Once a permission form is completed, the data is collected in an app that will then be accessed directly by the contractors, letting them know that they can move forward with work on each property.
To develop this app, Abonmarche took the concept of the Office Editor Web App (used to administer all data and work being performed) and refined the editing tools and pop-ups to only display and edit fields pertinent to the information office administrative staff would be receiving from property owners. Two new view layers were created—Right of Entry and Comments—each with a unique symbology to show the ROE status and if the comments were addressed. Each view layer only displays and allows the editing of selected fields. In the app, each layer can be turned on or off depending on what information the person inputting data is receiving.
When editing the Right of Entry layer, the editor tool enables staff to indicate when an ROE form was sent and whether it was received and also upload a copy of the form as an attachment.
To track comments, a related table was set up that can log multiple comments for one address. The related table shows up in the editor tool when editing the comments layer and allows new comments to be logged. The layer is symbolized by a field designating if the comments have been addressed or not.
This app ensures the integrity of data by providing users with exactly what they need and ensuring that each user can only update what is required.
Project Manager Web App
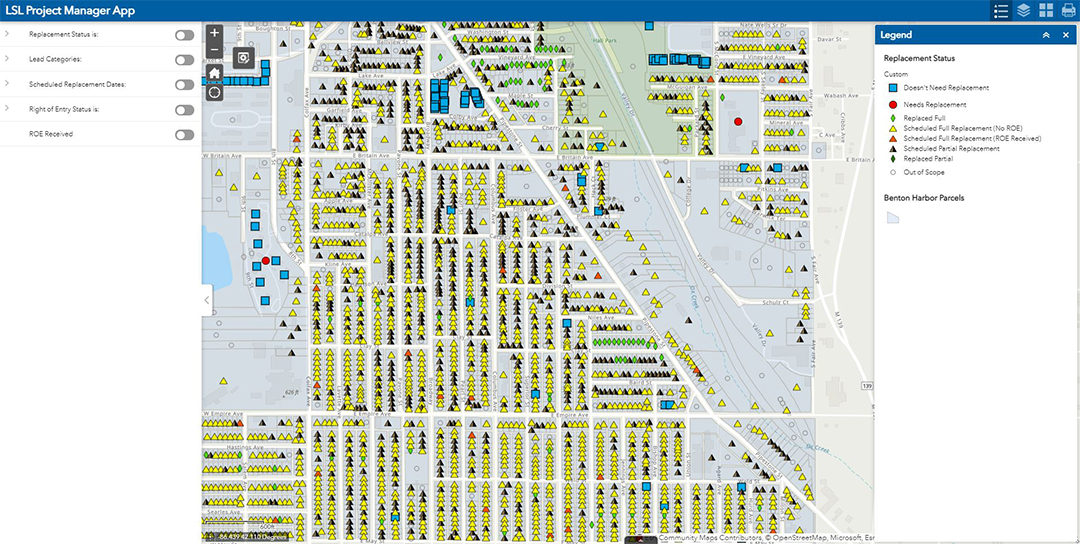
Using the built-in framework included in the Lead Service Line Inventory solution, project managers can track if an ROE form was received for every property. A Right of Entry form allows the contractor to enter a residence to make a final service line connection. Without this permission, work cannot be completed. Knowing which homes have given ROE permission is an essential tool for this project. Using ArcGIS Pro, Abonmarche was able to load the web map that feeds the Project Manager Web App, then use the expression builder to code a unique symbology expression to display scheduled replacements—and if an ROE form was received or not. This allows scheduling which replacements can be made, ensuring that the field crews and inspectors are performing the correct work on the correct asset.
Field Maps Mobile App
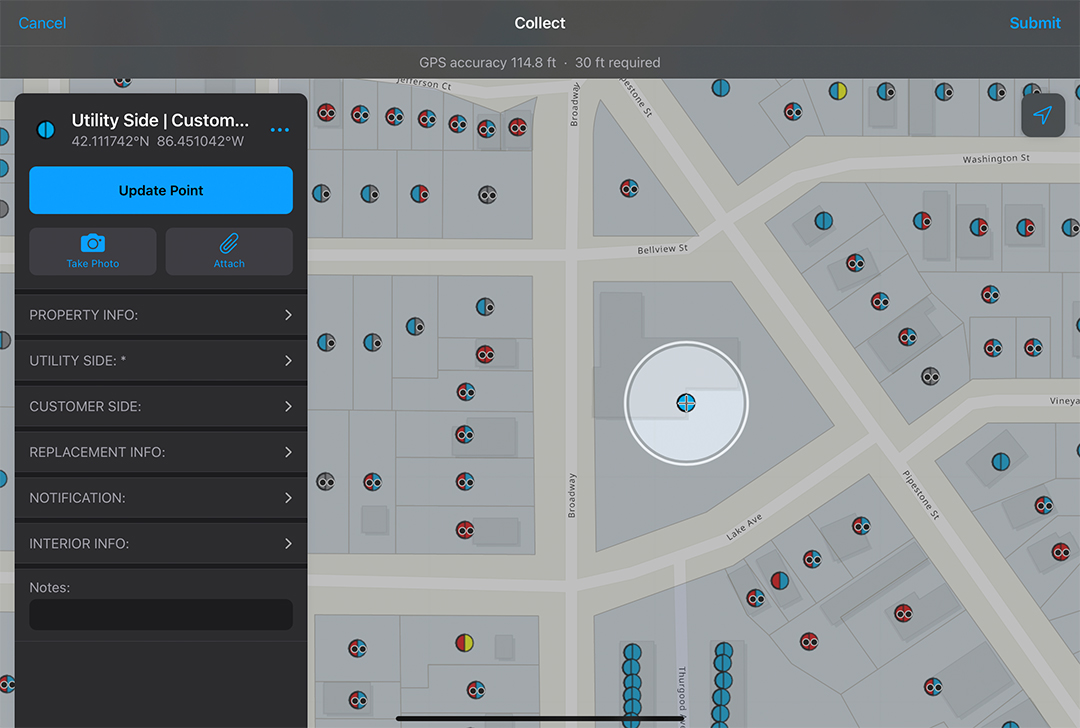
The ArcGIS Field Maps mobile application is the key piece for logging mobile work into the GIS. Web maps are set up for both contractors and inspectors that can be viewed and edited within the Field Maps mobile app. Using view layers enabled only fields relevant to the data collector to be displayed, and the forms feature within Field Maps allows the data entry fields to be organized into categorized drop-down menus for quick navigation and legibility. Collecting data at the point of inspection with Filed Maps is the driver for the rest of the data sharing and publishing abilities. Data integrity and data quality are maintained through required fields and domain values.
Office Editor Web App
The Lead Service Line Inventory solution provided an excellent tool for entering service line information into the GIS from the office environment. Whenever existing records are received or new data insights are made, they can be easily entered into the Lead Service Line Inventory by office staff. The tool can also be used to correct errors that may have occurred with mobile data inputs. Like the Project Manager Web App, symbology was updated to show some unique customer-side statuses, including “customer-side not constructed” or “out of scope” because there was no current customer. The web map that feeds the Office Editor Web App was loaded into the ArcGIS Pro desktop program and the expression builder was used to set a new unique symbology as well as update the symbology template displayed on the editor tool in the web app. The Office Editor Web App is used to administer all data and work being performed within the Lead Service Line Replacement program.
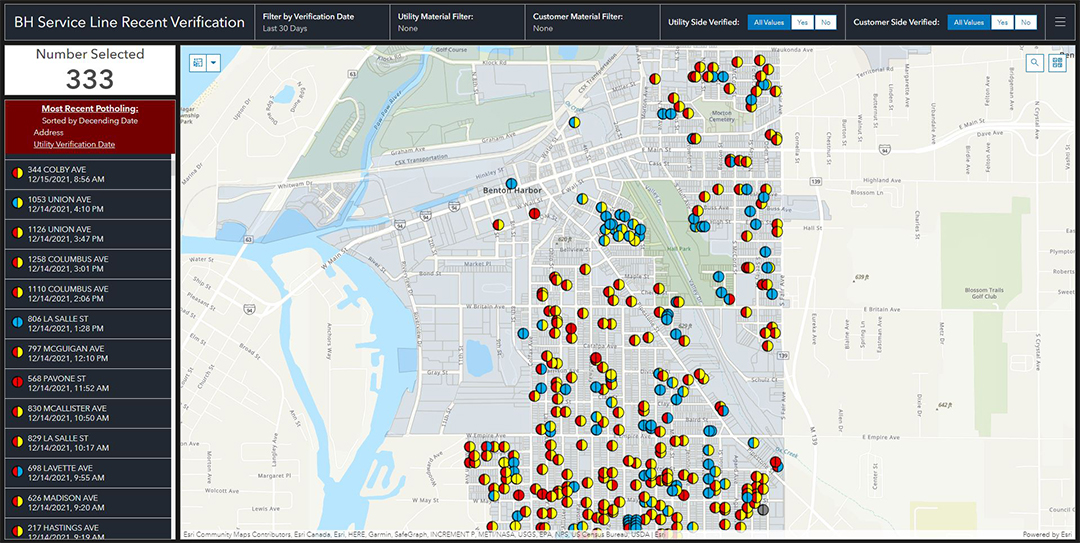
Recent Verification Tracking Dashboard
One of the top goals was to be able to quickly track work that was being done and categorize that work in order to quantify the results for informative purposes. Esri’s list widget enabled data shown on the map to be sorted by verification date, which will always show the most recent inspection at the top, listing the address and date. An indicator widget above that list displays the number of services shown on the map. Then, we applied a series of category filters that provide the address, number of services in that category, and map locations for any given category. This has been useful in making quick data checks and ensuring that any issues are identified early before they can become a problem.
Real-Time Data and Real-Time Transparency for a Community in Need
The Esri solutions implemented enabled the data to be tracked digitally and more accurately in a way that made the most sense. It also allows Benton Harbor to share real-time data with the public in an easy-to-digest method.
The dashboard, available on the City of Benton Harbor website, is updated in real time to reflect current progress and includes a map with the location of each house, along with two charts showing the materials each service line is made of on the city side and customer side. The dashboard also shows the dates and addresses of the service lines replaced in the past 30 days, offering a valuable monthly snapshot to the community.
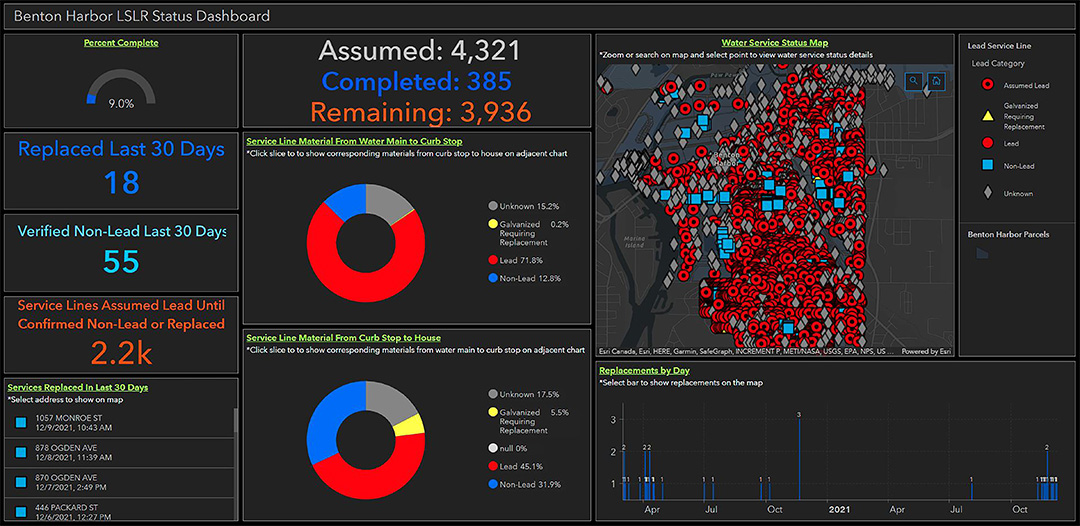
“Once we published the project dashboard, we immediately received favorable responses from state, local, and federal agencies and various media outlets about how helpful it was to them for their functions regarding the project,” says Jason Marquardt, senior project manager at Abonmarche. “It has been a great resource that was easy to implement and will be a key tool for this project as we see it through to completion.”
“This Lead Service Line Inventory solution has saved our team and Benton Harbor hundreds of valuable hours that can now be spent in other ways. Without using GIS and its accompanying apps and tools, our contractors would be manually filling out forms and sending them to us in bulk; our team would have to then parse through and manually input that data into a spreadsheet to compare with our list of active accounts and manually generate weekly reports of work done,” says Garrick Garcia, GIS technician at Abonmarche.
“There is a tremendous amount of forward momentum to getting these pipes out of the ground as a key part of removing the threat of lead from the city’s drinking water,” Benton Harbor Mayor Marcus Muhammad said in a press announcement shortly after the dashboard went live. “This dashboard gives residents a window into the aggressive work being done throughout the city.”
“I believe the state-of-the-art Lead Service Line Replacement dashboard is an outstanding example of how technology can provide continuous up-to-date information to the public on whatever they want to know about what is happening with a project like the City of Benton Harbor’s Lead Service Line Replacement program,” added Alex Little, Director – Community & Economic Development / Assistant City Manager at the City of Benton Harbor. “The city is pleased to have this resource available to the public on our website.”
Using the new system, all work is shown in real time, updates on work completed are shown instantly, and the GIS data can be used to autogenerate any needed documentation. We now have the ability to work digitally and communicate more accurate data, quicker. We can now show the public our tangible progress — eliminating paper updates, transposing information, and avoiding redundant data entry, so that citizens can see the work happening in real time.
This article is also published on the ESRI website, viewable at:
https://www.esri.com/en-us/lg/industry/water/stories/lead-service-lines-data-transparency-for-a-community-in-action
